News & Events
MasterLibrary
Maximize Facility ROI with Smarter Scheduling
March 7, 2025
Your facilities can do more than serve your school – they can generate revenue and community impact! Join us to explore how the latest enhancements in...
Read More

New ML Products Release Notes (March 2025)
March 4, 2025
Our March 2025 release notes for ML Schedules and ML Work Orders have been published!
Read More
Harness the Power of Facility Asset Management
February 18, 2025
Facility management is about more than just keeping the lights on – it’s about driving efficiency, accountability, and smarter decision-making across your district. In this webinar,...
Read More

Follett Software Facilities Suite Exclusive Webinar for NERIC Districts
January 17, 2025
Join us at 12:30pm, Thursday, February 27, for an informative one-hour webcast where you can see the software in action and get your questions answered.
Read More
MasterLibrary was honored to be a Key Supporter at this year’s SFMI Winter Academy
December 9, 2024
The team at MasterLibrary is greatly appreciative to have been able to sponsor this event to show our support for the facilities directors across…
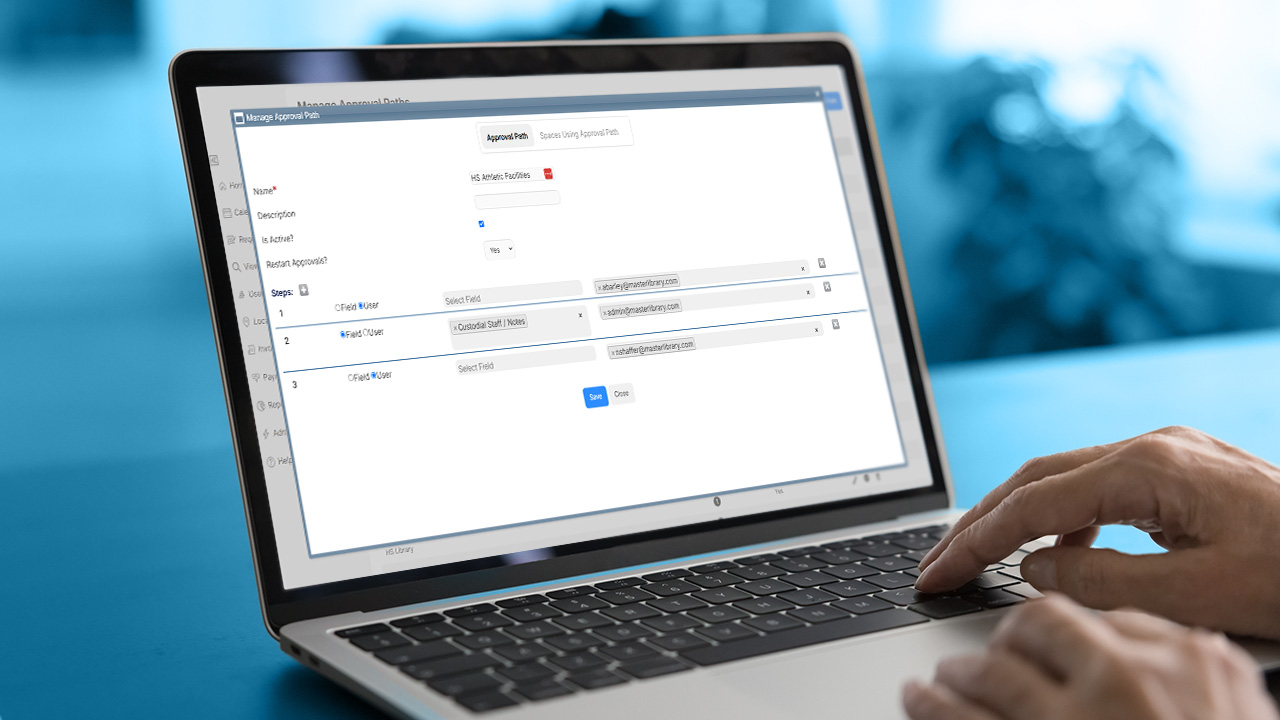
New ML Schedules Approval Path Feature
November 21, 2024
As MasterLibrary has continuously added new features that address and bring resolution to the unique needs of school districts, our team was able to implement a...
Read More
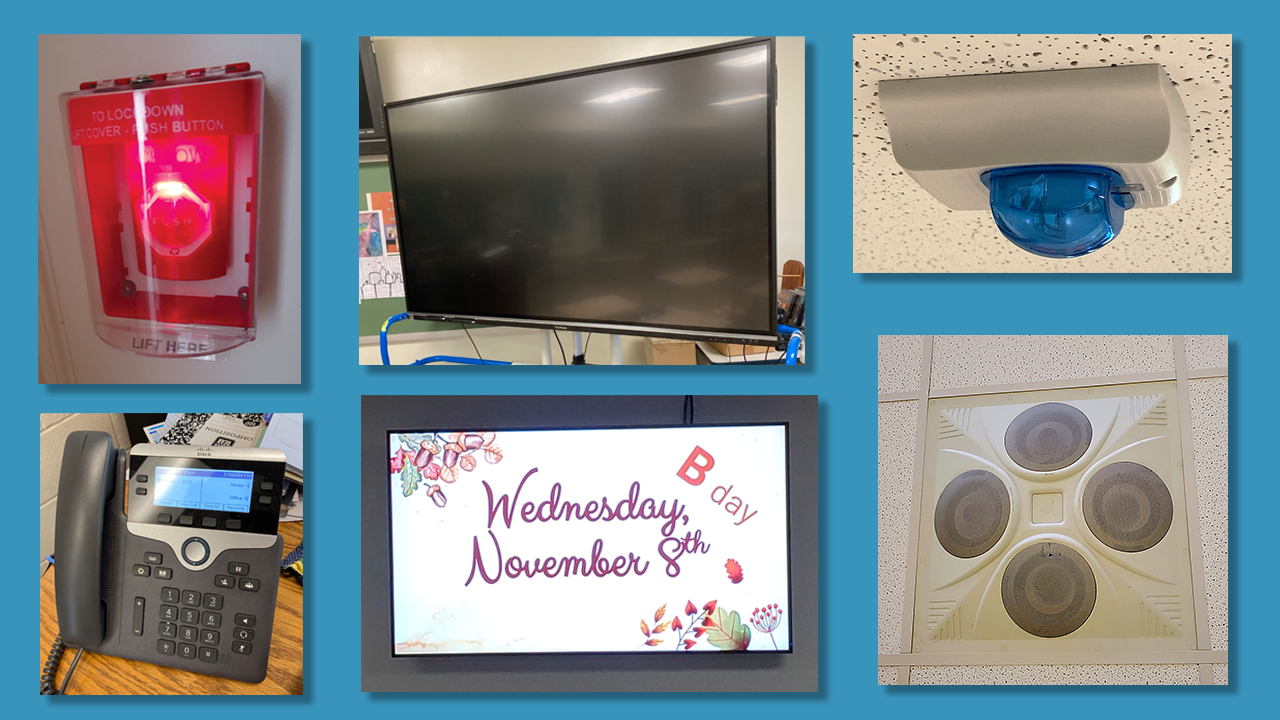
Controlling a lot more than just school building doors.
October 23, 2024
Today's Access Control systems trigger a large number of "downstream" events using many hardware devices. Improve capital planning with a better understanding of this interconnectivity.
Read More
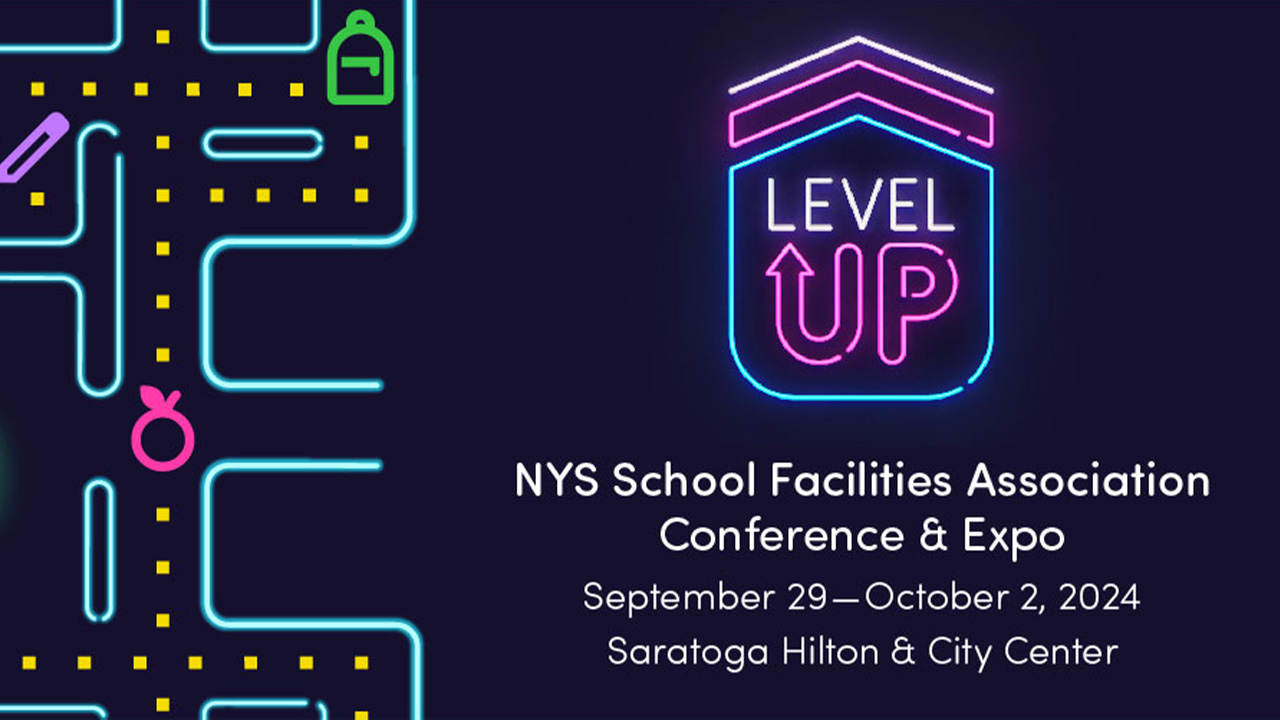
Visit Us in Booths #207 and 208 at the NYSSFA Conference and Expo
September 26, 2024
MasterLibrary will be a Key Supporter sponsor at the 2024 NYSSFA Conference and Expo in Saratoga Springs, New York on September 29th and 30th.
Read More
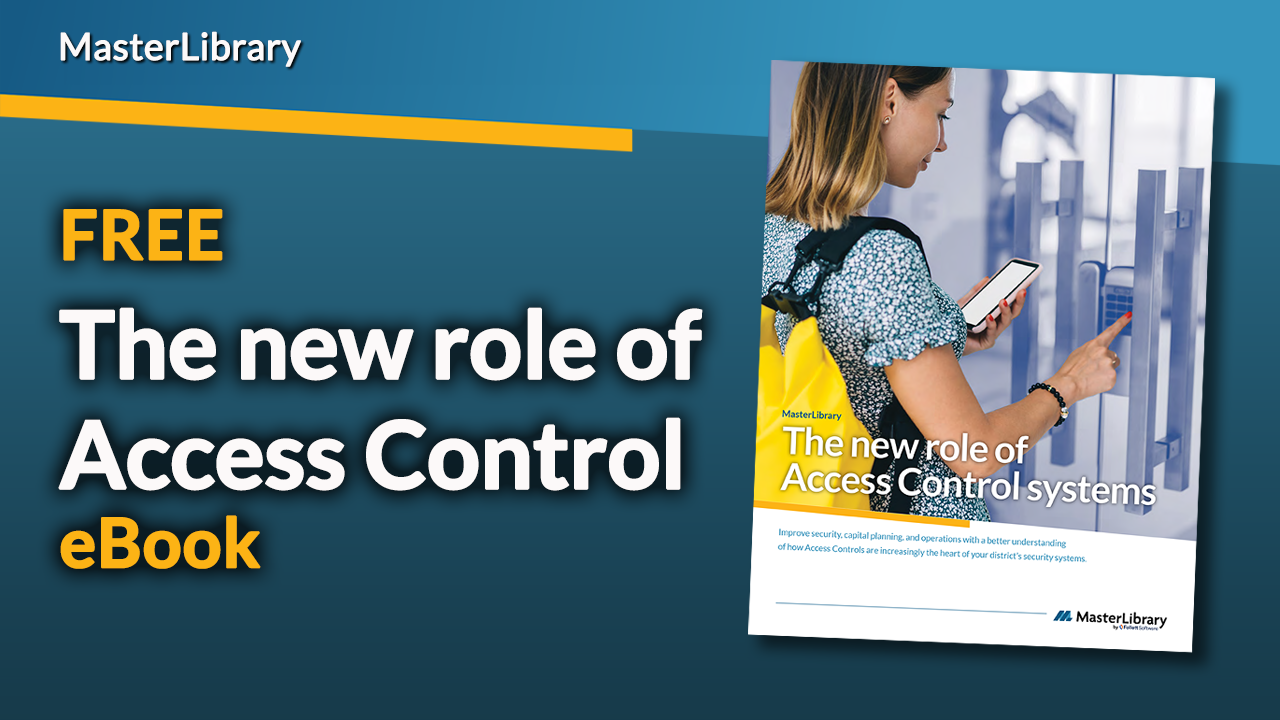
“The new role of Access Control” eBook
September 5, 2024
Gain a better understanding of the complexity of today’s K12 school district building-based security, life safety, and communications systems and endpoint devices in this 12-page eBook.
Read More